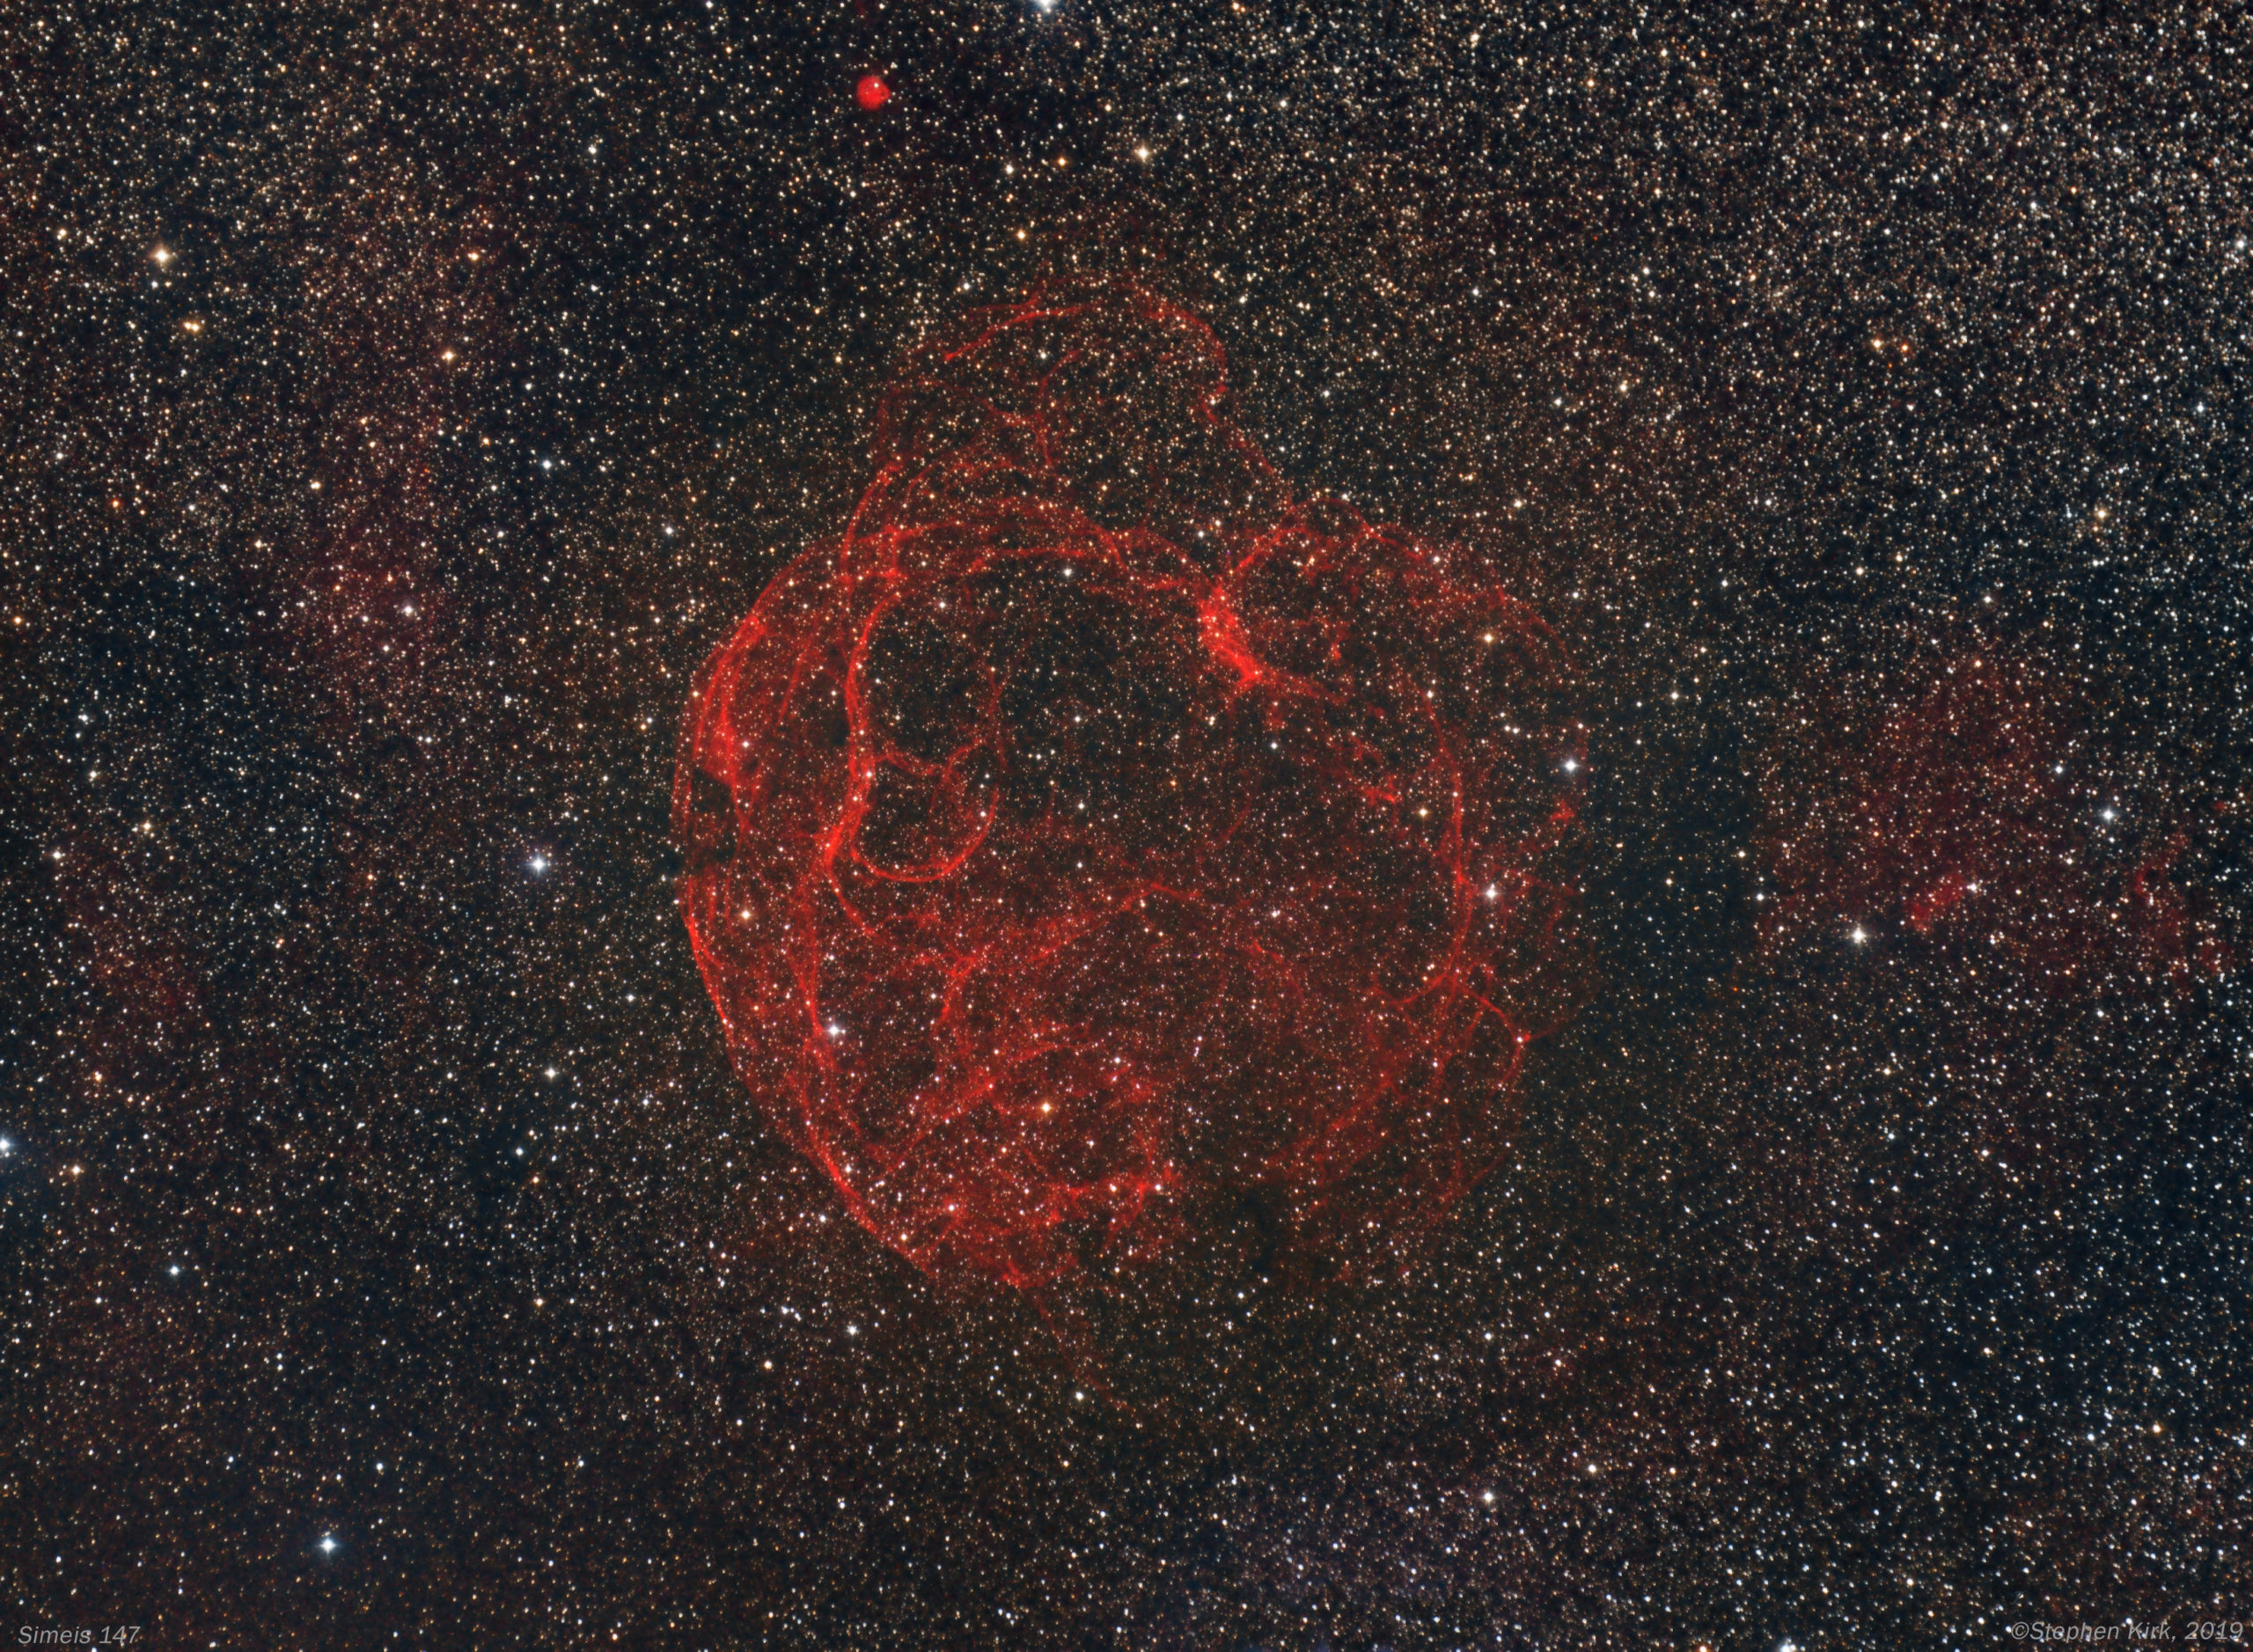
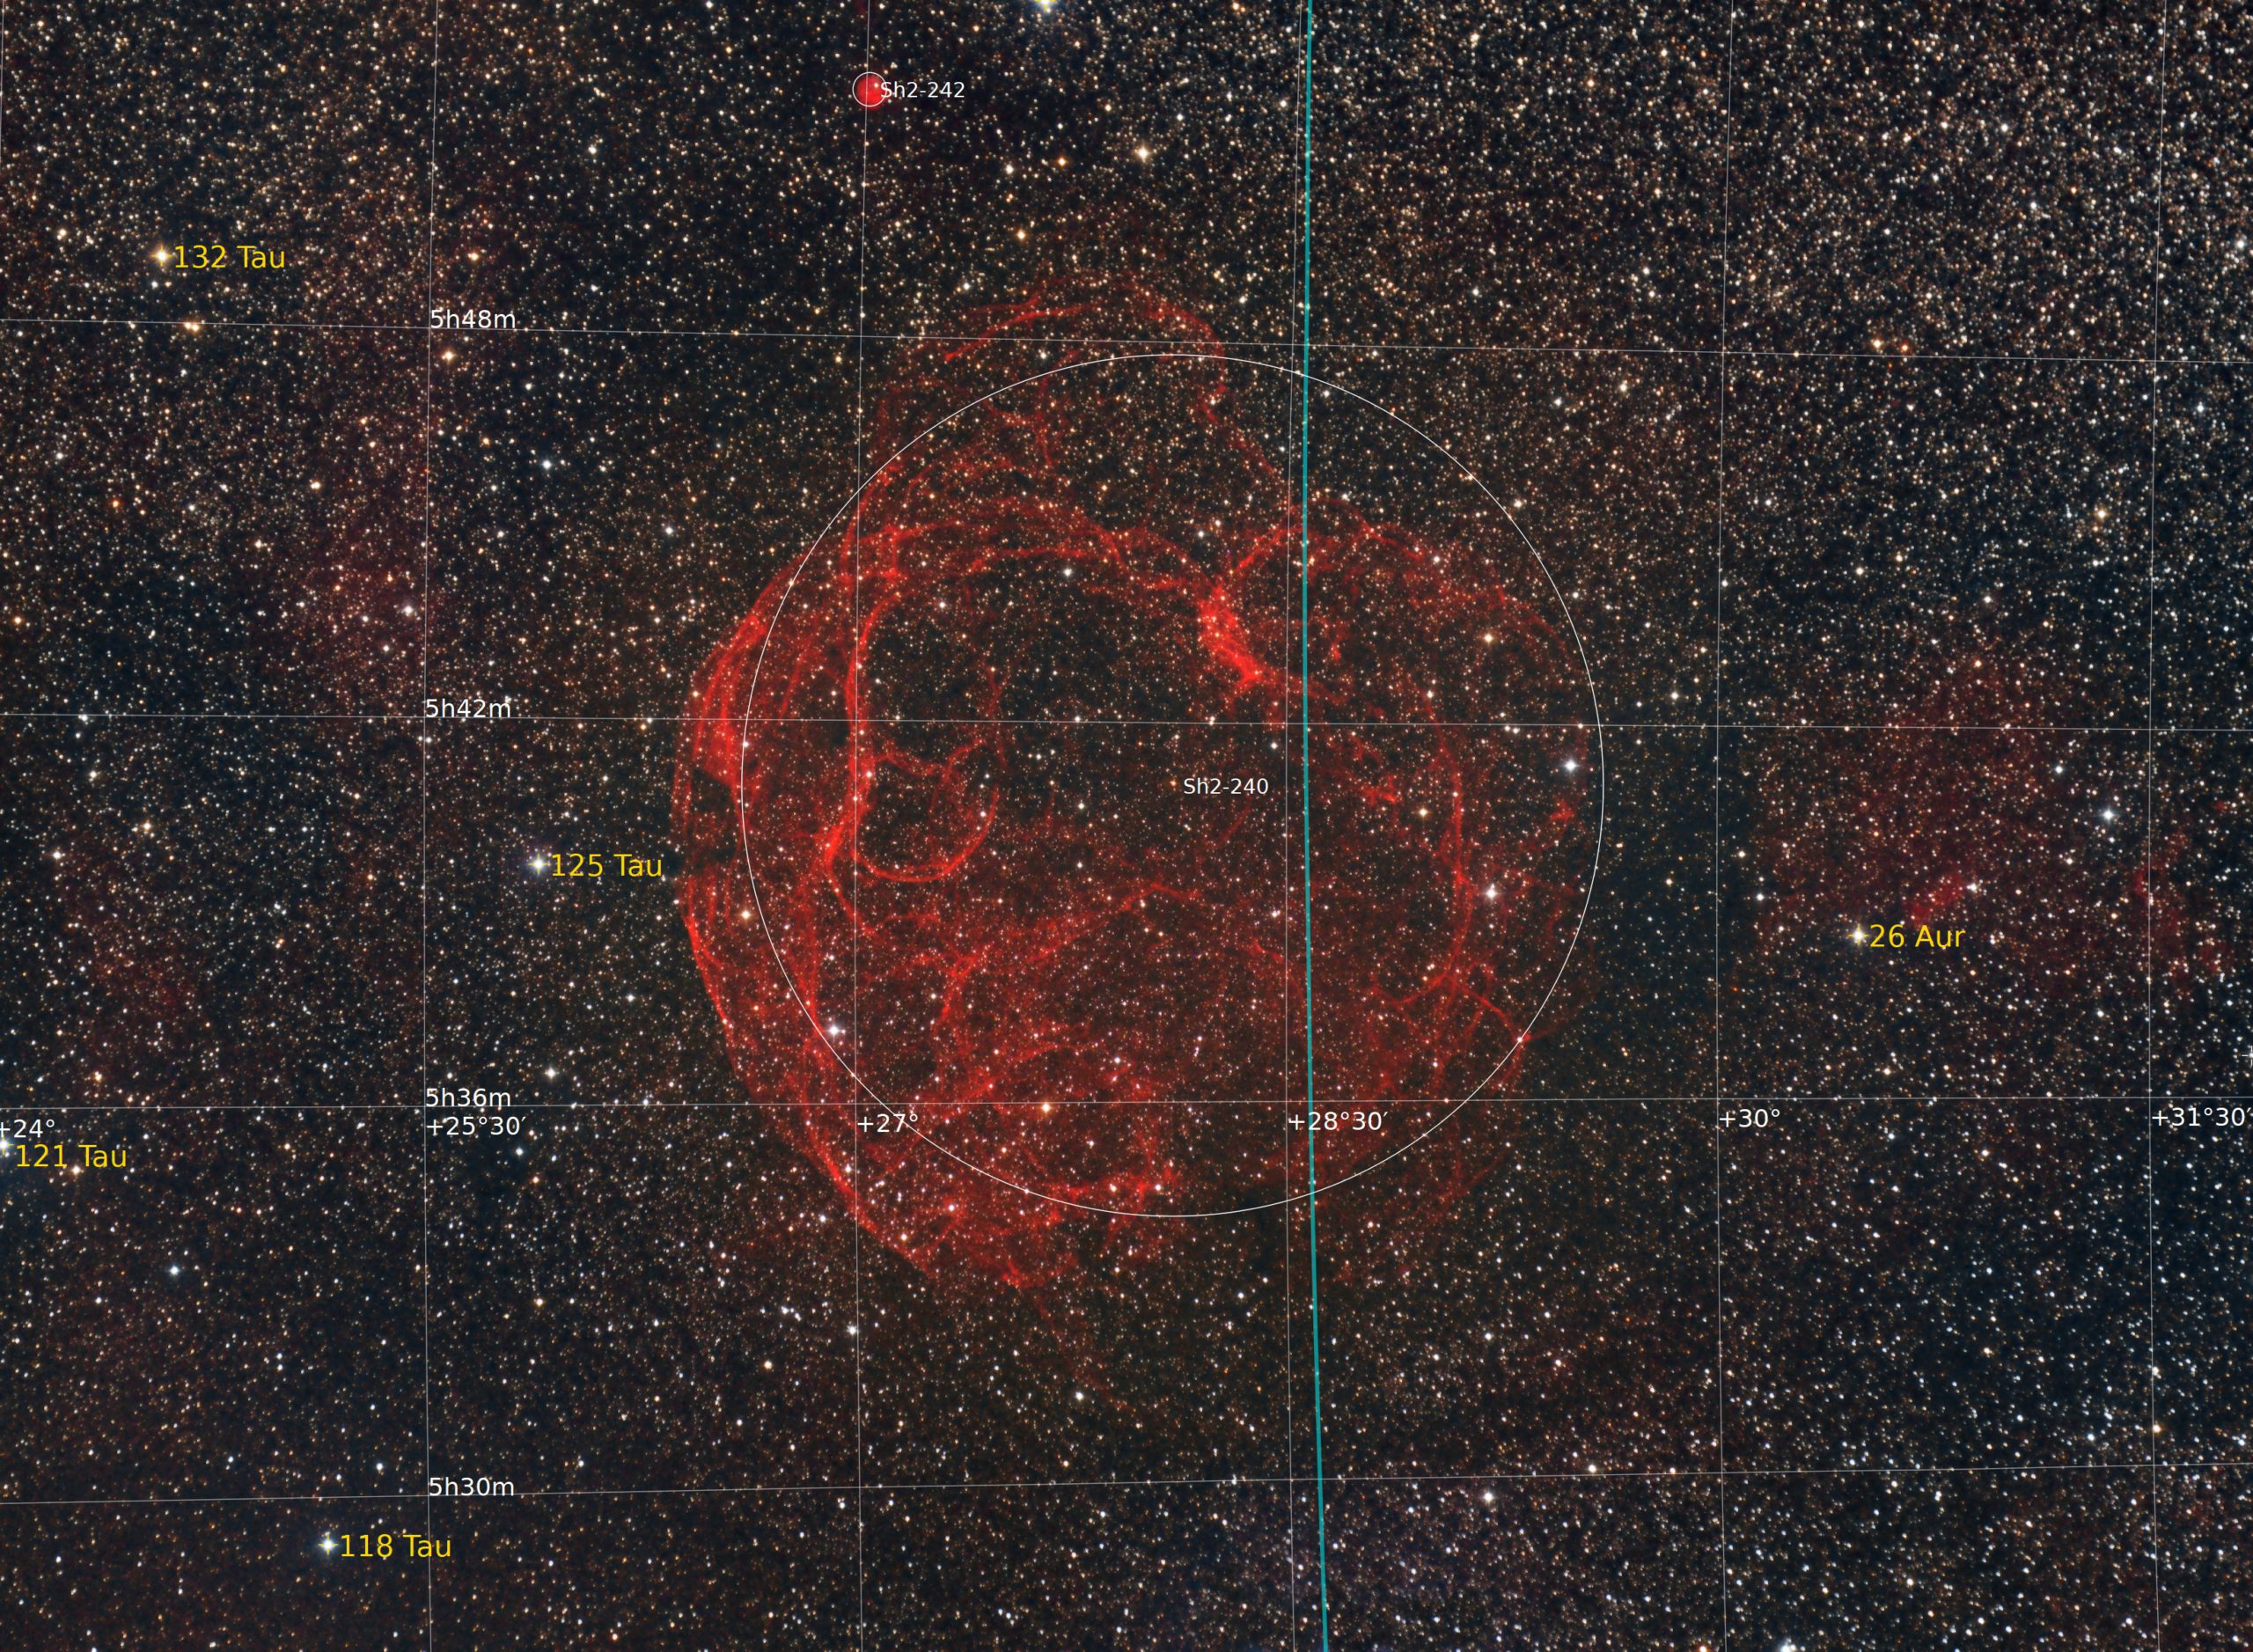
Simeis 147 (Sharpless Sh2-240) sometimes called The Spaghetti Nebula is a supernova remnant of a star that exploded forty thousand years ago. It sits across the border of Taurus and Auriga and is a huge object, about six moon widths across. It is located about 3000 light years away. Because of its extremely low surface brightness it was only discovered as recently as 1952. It is an exceptionally difficult object to observe visually and to have any hope of seeing it with your own eyes at the eyepiece requires extremely dark skies (Bortle 1), specialist filters, immaculate seeing and transparency and extreme dark adaption of your eyes. This rules out almost anywhere near civilisation. Personally speaking, I have never known any astronomer who has seen it visually. Even with photography it requires very long exposure times to bring out any detail.
Image Technical Data
This image was created with my wide-field rig in my backyard in Nottingham UK (Bortle 5 on the dark sky scale) on the 20 and 21 December 2019. It is such a wide-field object that I used my Samyang 135mm lens and Moravian Instruments G2-8300 cooled CCD camera with Astrodon RGB and Ha(3nm) filters. This delivers a FoV of 8×6 degrees.
All exposures binned 1×1:
Ha (3nm) > 22 x 300s ; Red > 8 x 300s ; Green > 9 x 300s ; Blue > 10 x 300s
The total integration time is four hours so far and this is a rather short time for this object. More data would bring out finer structures in the nebula. As a result, I may revisit this at some point and add to the data set already acquired. However, the current result is not so bad for the limited amount of data so far captured. Simeis 147 is so faint that it can consume as much data as you can throw at it and I have seen images of it with 30,40 and even 50 hours of data!
The Image data is captured with Sequence Generator Pro and processed with PixInsight and Photoshop CC.
Other versions of this object often include an Oxygen channel (OIII) because supernova remnants are rich in Hydrogen and Oxygen. I may capture this channel too at some point.
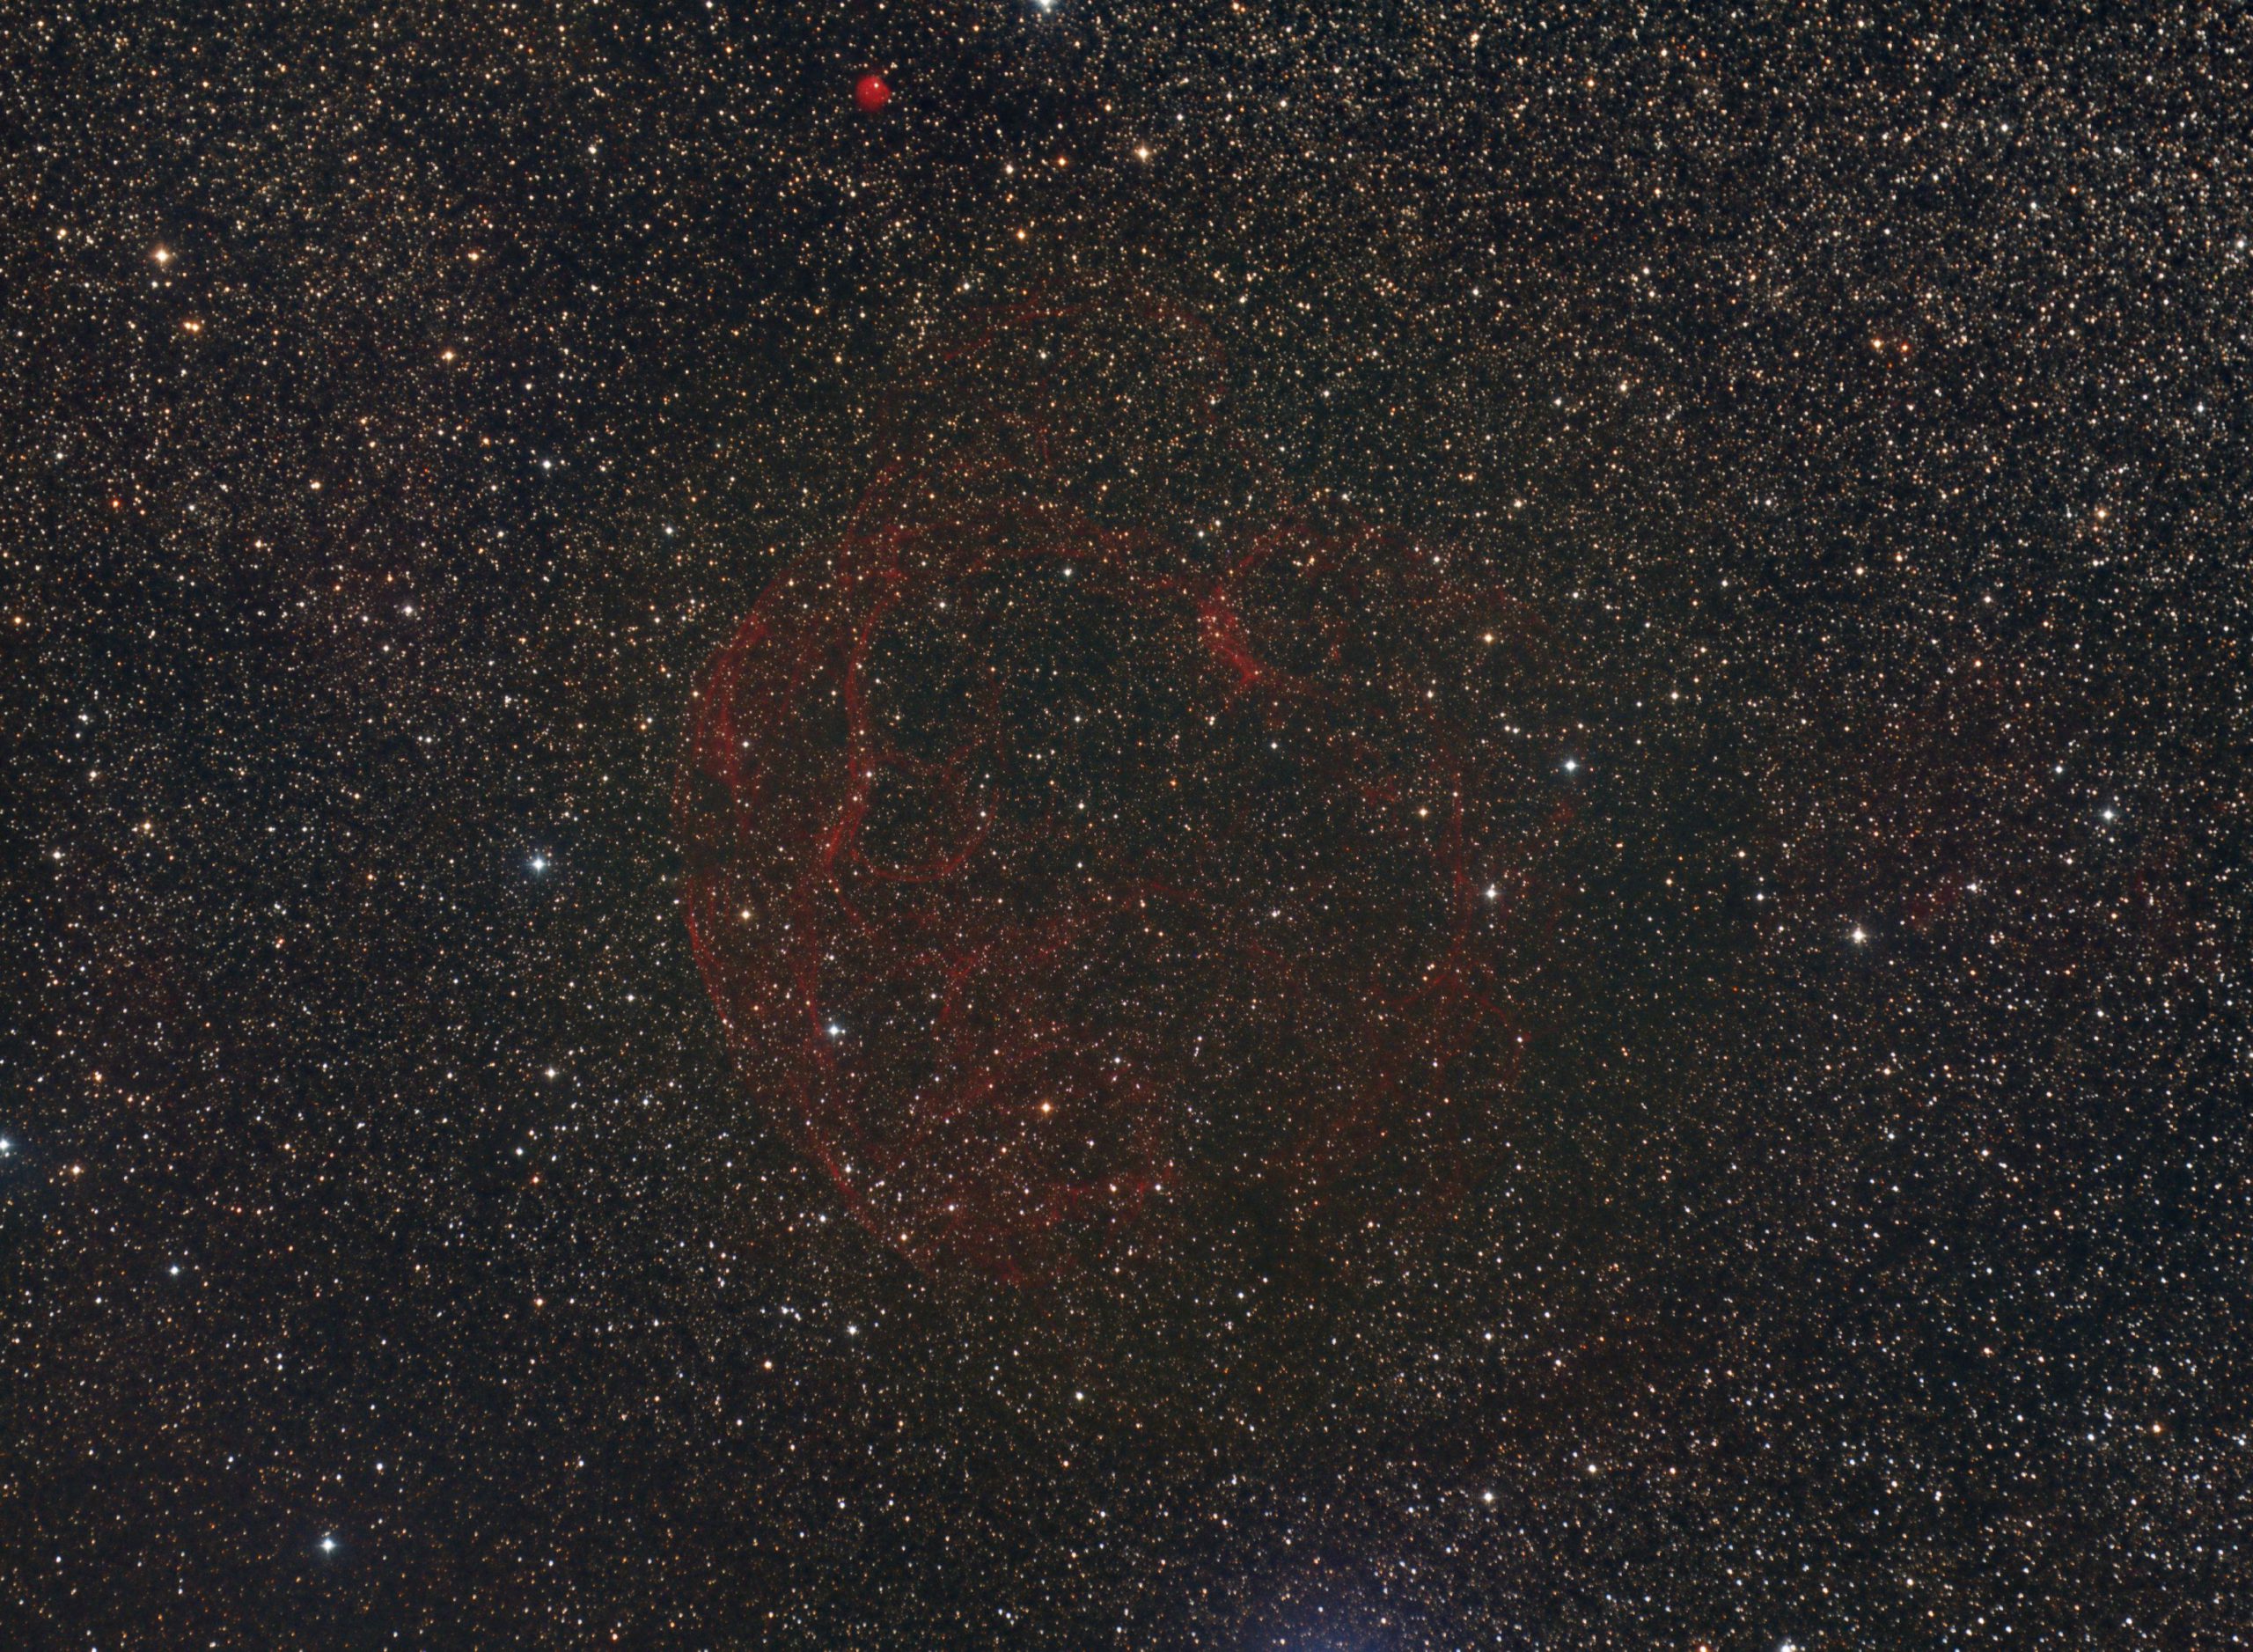
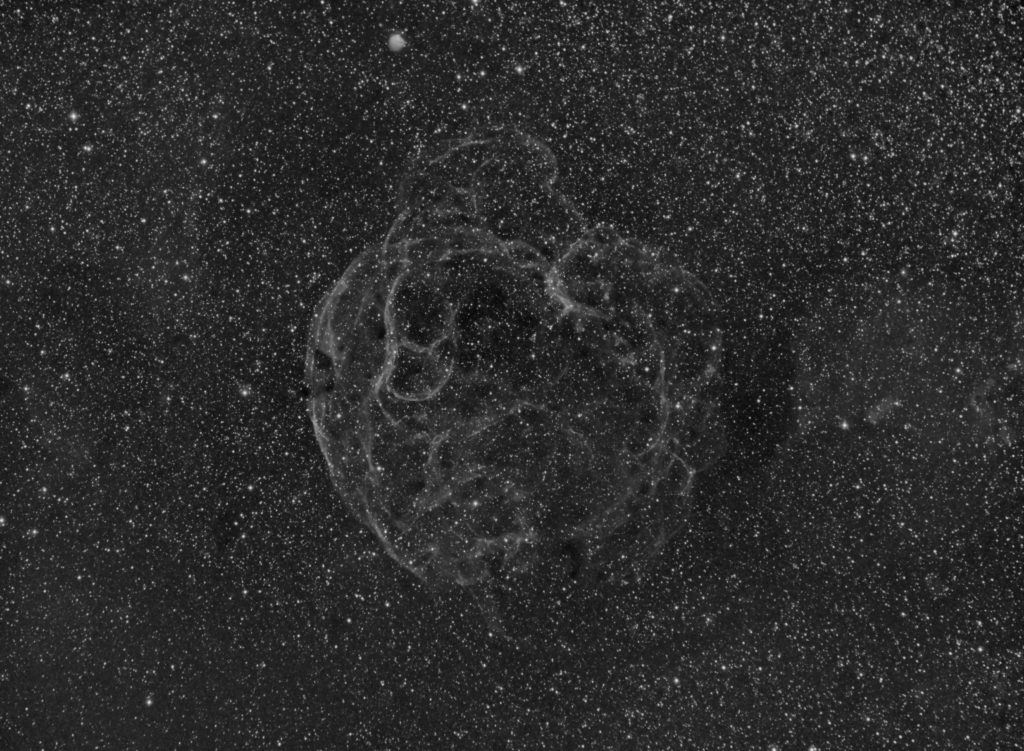
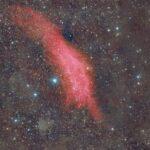
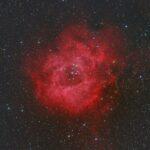
Above is the RGB only data. As you can see, there is very little to show for the data collected. It is when you blend this RGB with the Ha channel data below – especially with the red channel – that the detail in the main picture in this post at the top is revealed.

Comments are closed.